The Browser and the CPU: A Mystery I Finally Solved
The Shortlist
Picking Vivaldi in the first place wasn't an accident — I'd actually run a small comparison before settling on it:
- Chrome — no built-in adblock, and with Manifest V3 rolling out, uBlock Origin's full filtering capability was effectively gone. A non-starter for daily browsing.
- Brave — fine overall, but consistently ran slightly higher CPU than the others in my casual testing.
- Opera — everything worked well except one petty, persistent annoyance: the tab close button was too small. A silly thing to weigh a browser decision on, but it bugged me every single day.
- Firefox — solid across the board, no real complaints, except RAM usage ran noticeably higher than the Chromium-based options.
Vivaldi won by elimination more than by excelling at any one thing. No adblock issues, reasonable CPU, no tiny-button annoyance. Good enough to commit to. But as I used it, I genuinely started to like it.
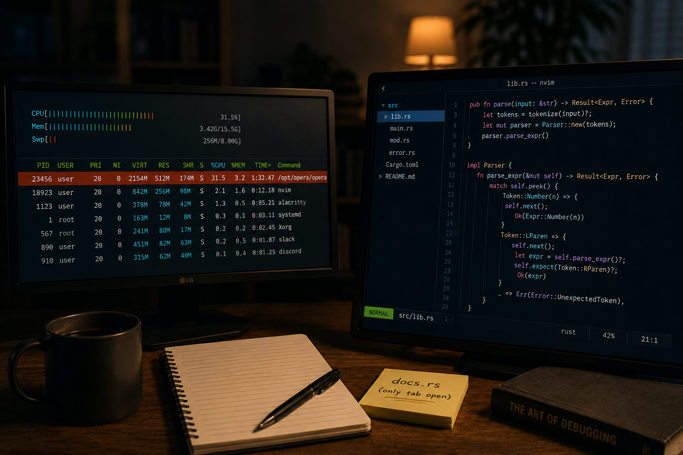
One day I was deep in a Neovim session, fingers on the keyboard, browser nowhere near focus, when my fan started spinning like it was trying to take off. I checked my system monitor. Vivaldi — a browser I wasn't even using — was eating 35% CPU.
I switched over. One tab. docs.rs. That's it. No video playing, no animation, nothing visibly happening. Just a documentation page, quietly cooking my CPU in the background.
That was intolerable. So I did what any reasonable developer does: I blamed the browser and left it.
Enter Opera
I quickly installed Opera and uBlock Origin, did the comparison, and saw CPU usage was fine on Opera. I ran through the same shortlist again, quickly, and landed back on Opera. For a while, life was good. No mystery spikes. No fan noise while I was off coding in another window. I assumed Vivaldi had some specific inefficiency — maybe its tab-hibernation logic, maybe something in its rendering pipeline — and Opera simply didn't have that problem. It's often said that Vivaldi's UI is built with CSS, and the rendering engine has to render all of that. Maybe that's it.
And the tiny close button? Still there, still mildly annoying. I decided to just live with it. Clean CPU usage was worth the trade.
Case closed. Or so I thought.
The Sequel Nobody Asked For
Months later, same scene: I'm in Neovim, the fan ramps up, and I check my system monitor. Opera. 30% CPU. I open it. One tab. docs.rs.
Déjà vu.
This time I had a theory ready-made: somewhere along the way, I'd moved my browser config directories off my SSD and onto a spinning hard drive to free up space. Chromium-based browsers do read and write to their profile directories fairly often — could a slower disk somehow translate into elevated CPU usage? It felt like a stretch even as I typed it out, but it was the only variable I could point to that connected both browsers. Vivaldi's profile had been on the HDD. So was Opera's now. Maybe that was the common thread.
Before yanking the config folder back onto the SSD on a hunch, I decided to actually investigate instead of guessing.
Asking for a Second Opinion
I described the situation to Claude and asked what could be going on. The first useful thing it did was push back on my disk-location theory — a slower drive could explain occasional I/O stutters, but not a sustained, idle CPU draw from a single static documentation page. It also pointed out that while docs.rs does ship a fair amount of JavaScript, sustained idle CPU load on it isn't a commonly reported issue — usually any spike is brief, tied to initial page load, not something that persists.
Rather than chase the disk theory further, it suggested a much more direct diagnostic path:
- Open the browser's Task Manager. Every Chromium-based browser has one — Shift+Esc is the usual shortcut. This separates CPU usage by process: is it the GPU process, a specific tab, or an extension burning the cycles?
- If a tab is the culprit, open DevTools → Performance tab and record a few seconds of activity. The flame chart that comes out the other end tells you exactly what's running and for how long.
Shift+Esc didn't fire in my setup, but Opera's menu had the Task Manager tucked away, so I opened it from there. Sure enough — it wasn't the GPU process. It was the tab itself.
Recording the Crime
I switched to DevTools, hit record on the Performance panel, and let it run for about seven seconds — a little long, but it didn't matter. A chunk of that idle CPU time was coming from a browser extension.
The Actual Culprit
The extension was a shopping plugin called BuyHatke — the kind that shows you a product's price history, predicts whether the price is likely to rise or fall, and tells you whether it's the right time to buy. Completely irrelevant to a Rust documentation site. Except, apparently, nobody told the extension that.
These plugins typically inject a content script into every page you load, not just shopping sites, because they don't know in advance which page is "shopping-related" — they have to look first. On a static page that should be cheap to scan, that's a one-time cost. But on a JS-heavy site like docs.rs, which keeps re-rendering and reacting to DOM changes as you interact with it, that content script apparently never fully settled down. It just kept working, quietly, in the background, indefinitely.
I disabled the extension. CPU usage dropped right back to normal.
The Real Lesson
Vivaldi was innocent. It never had a browser-level problem — it had an extension problem, and I happened to ditch it before I found that out. Opera wasn't actually better; it just hadn't been tested against the same extension long enough for me to notice, or the extension's misbehavior was somehow triggered again after a reinstall or update. Either way, the SSD-to-HDD config theory, my leading hypothesis going in, had nothing to do with it. It was a coincidence I'd built a whole narrative around because it was the only thing that had changed that I could point to.
It's a familiar trap in debugging: when two unrelated things change around the same time, it's tempting to connect them into a story that makes sense — "I moved the config, then the problem appeared, so the config must be the cause." But correlation isn't causation, and the fix isn't to act on the most convenient theory. It's to actually look.
In this case, "actually looking" took less than five minutes once I had the right tools open: Task Manager to find which process was responsible, and the Performance recorder to find what inside that process was responsible. No reinstalls, no profile migrations, no browser-hopping required.
Where I Landed
I'm staying on Opera. Not because it's provably better than Vivaldi — it isn't, as far as I can tell — but because I'm already here, and the actual bug is gone now that the extension is disabled. I'll keep it off on non-shopping sites and only flip it on when I'm actually buying something. Most Chromium browsers let you set an extension's site access to "On click" instead of "On all sites," which solves this permanently without the on/off toggling — that's next on my list.
The takeaway isn't really about Vivaldi or Opera at all. It's that when something in your system is misbehaving, the fastest path to an answer is rarely "guess and change a big variable." It's opening the tool built specifically to show you what's happening, and reading what it tells you.
TL;DR
If your browser is spiking CPU for no obvious reason, don't guess — check. Open the browser's Task Manager (Shift+Esc on Chromium-based browsers) to see if a specific tab is the one using the CPU. If it is, open DevTools → Performance tab, record a few seconds of activity, and read the flame chart to see what's actually running. In my case it wasn't the browser at all — it was a shopping extension running its content script on every page, including ones that had nothing to do with shopping.